Introduction
This is the first part of a small series where we invited Ironman and coach Thomas Mortensen into the paincave with Jesper to keep testing!
Both Thomas and Jesper are passionate about training and finding marginal gains, and we’re very excited about sharing some of the results with you!
Who is Thomas Mortensen?
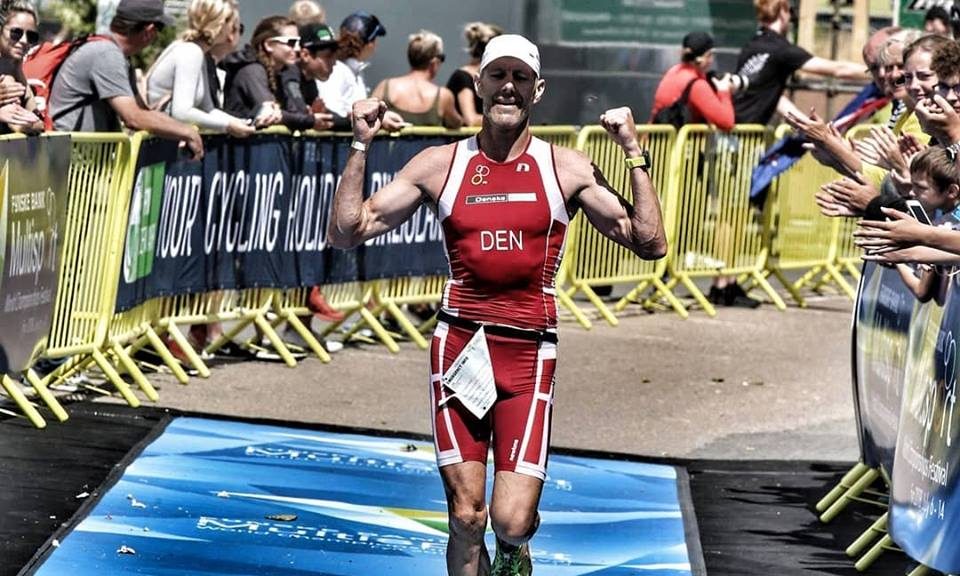
At GRASPOR, we love to nerd in our technology and act as sparring partners for our users. Last week we had a visit from 25 x Ironman, Thomas Mortensen.
Thomas has won the European Championships in ½ Ironman (AG) and World Championships in Cross Triathlon (AG) amongst other things.
In his daily life, Thomas now coaches a number of athletes in his company, Team Mortensen.
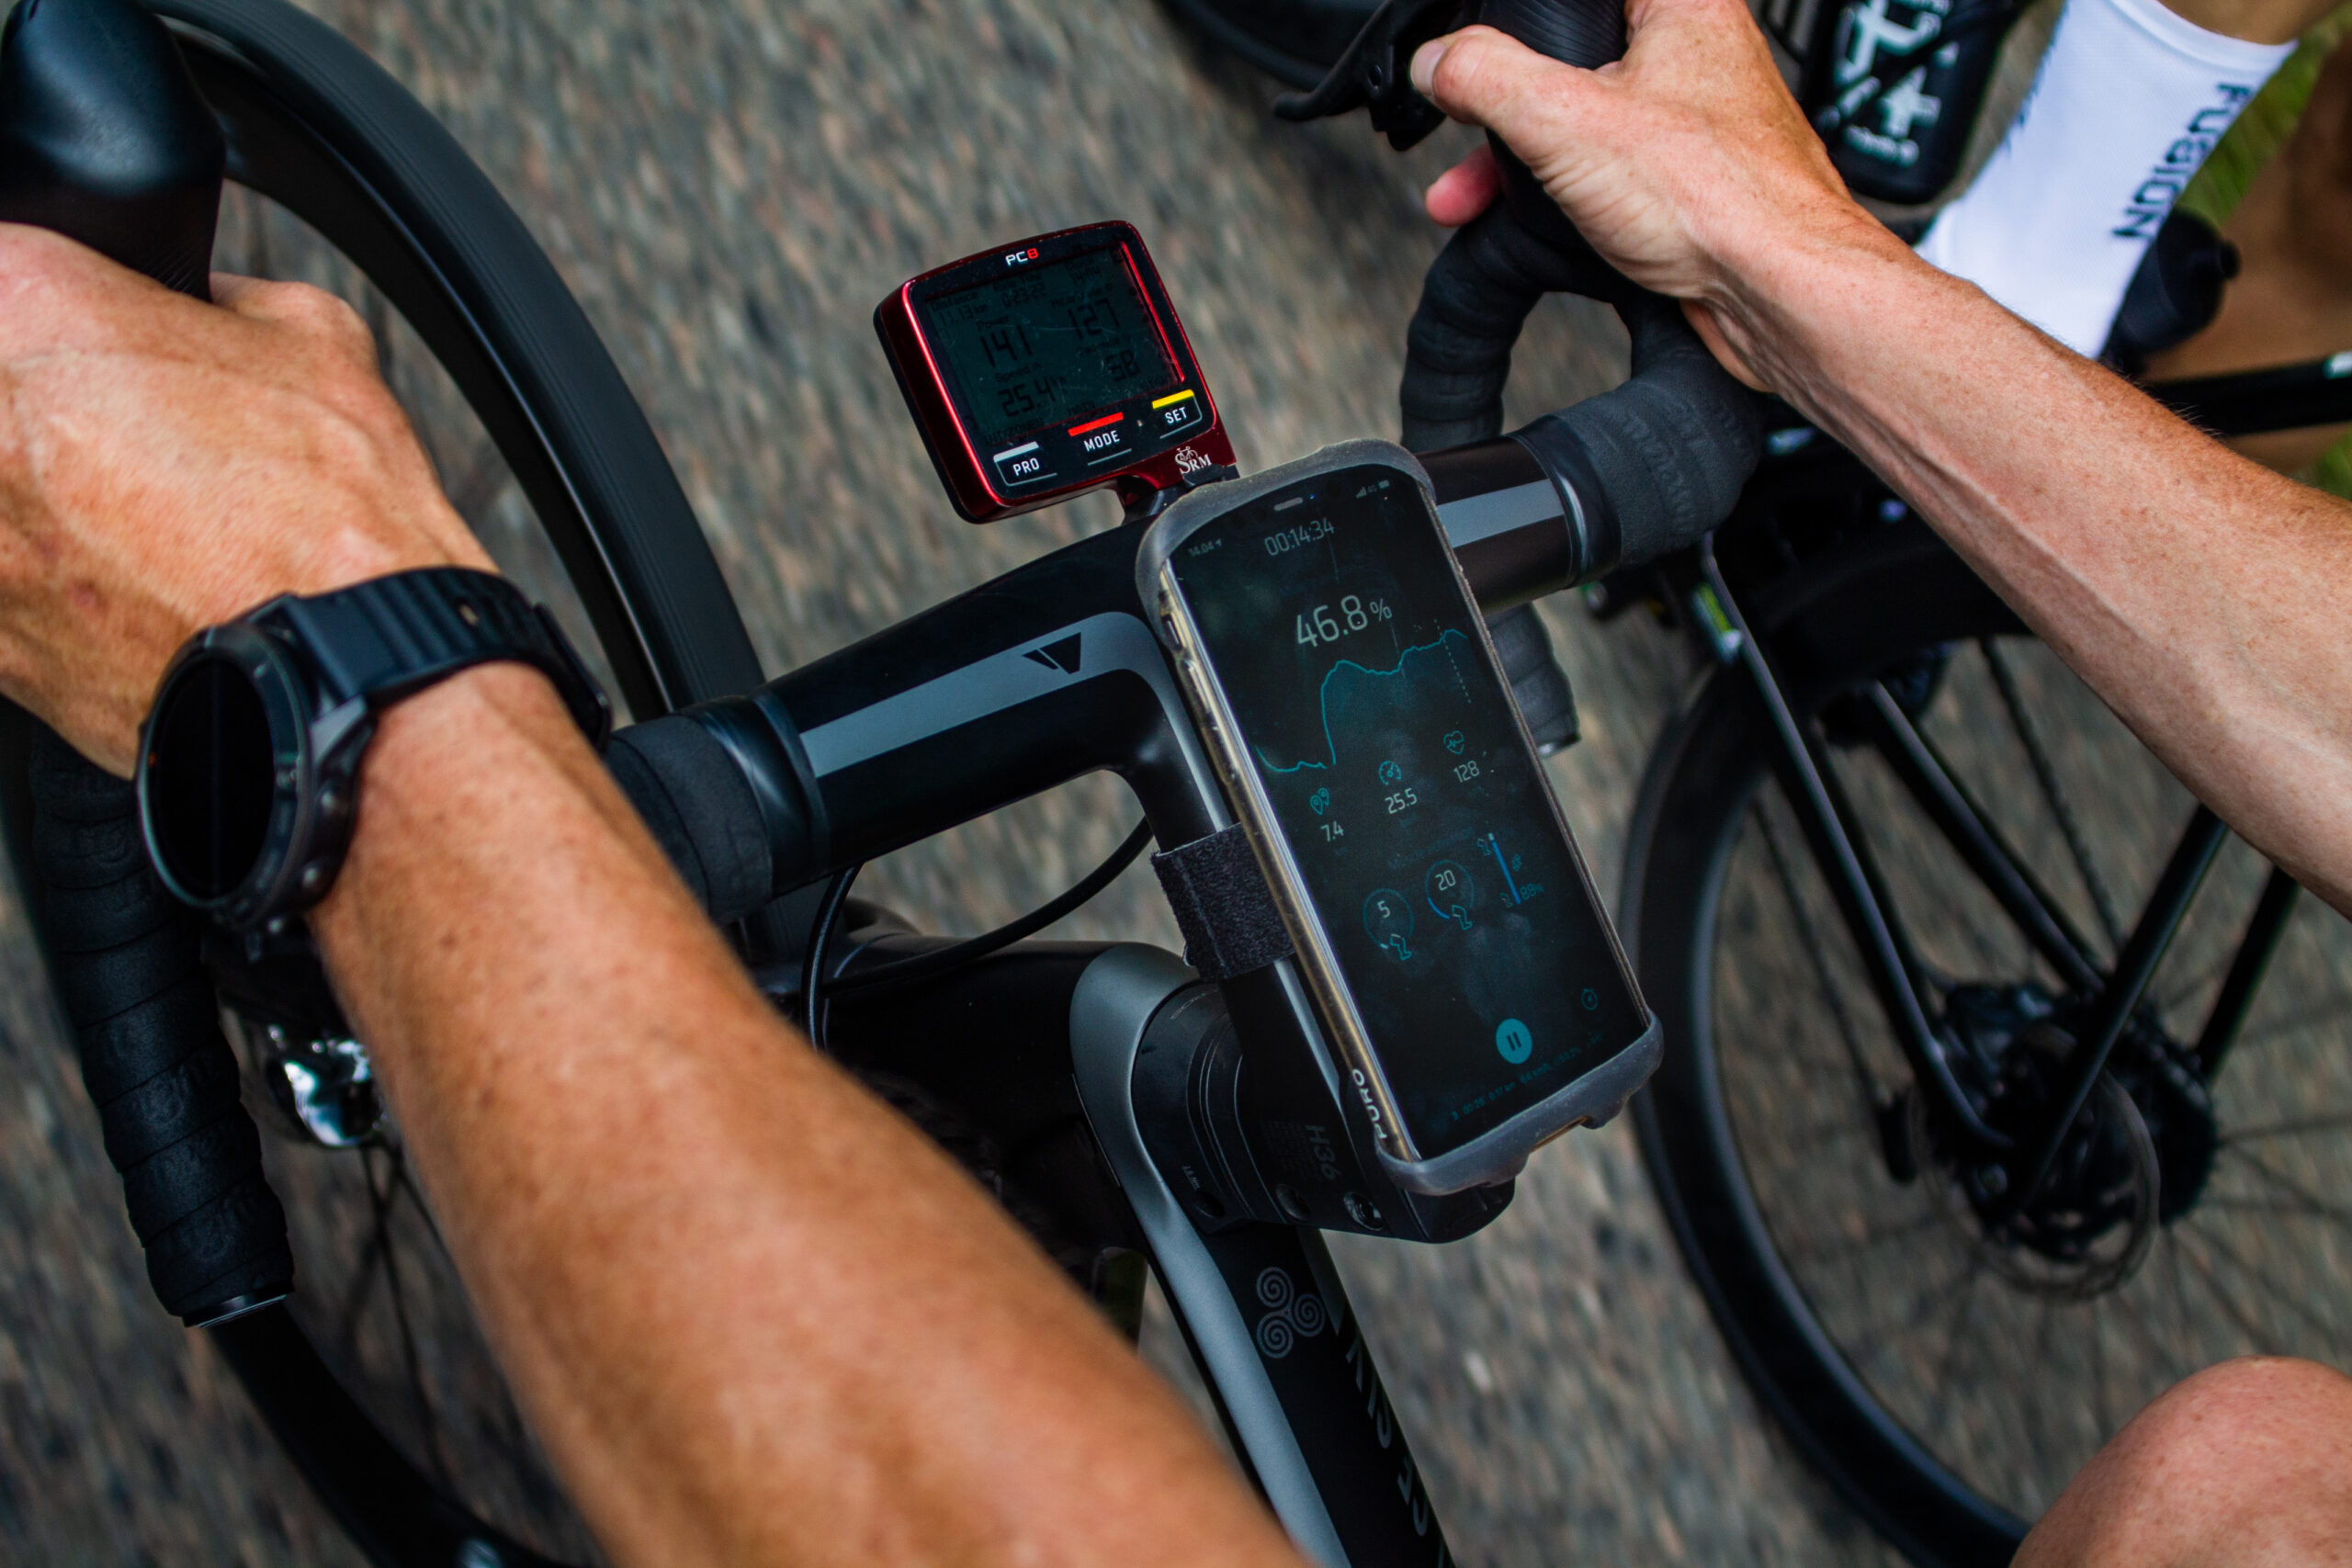
Once again, together with Thomas, our sales & commercial manager jumped into his cycling gear to test, and confirm or disprove, our theories about the effect of warm-up and compare results between the various test methods.
This article is what came out of it. It is divided into two parts; the first part, is explained here in honest terms by Jesper.
Lets hear from Jesper
In my previous article about ”Warming up: Cycling intervals”, I tested the effect of warm-up before subsequently riding 5 intervals of 3-minutes duration. One week I warmed up before riding these intervals, and the following week I rode them after rolling along steadily at 200w for eight minutes, without a proper warm-up.
The results, and the effect of the warm-up, amazed me.
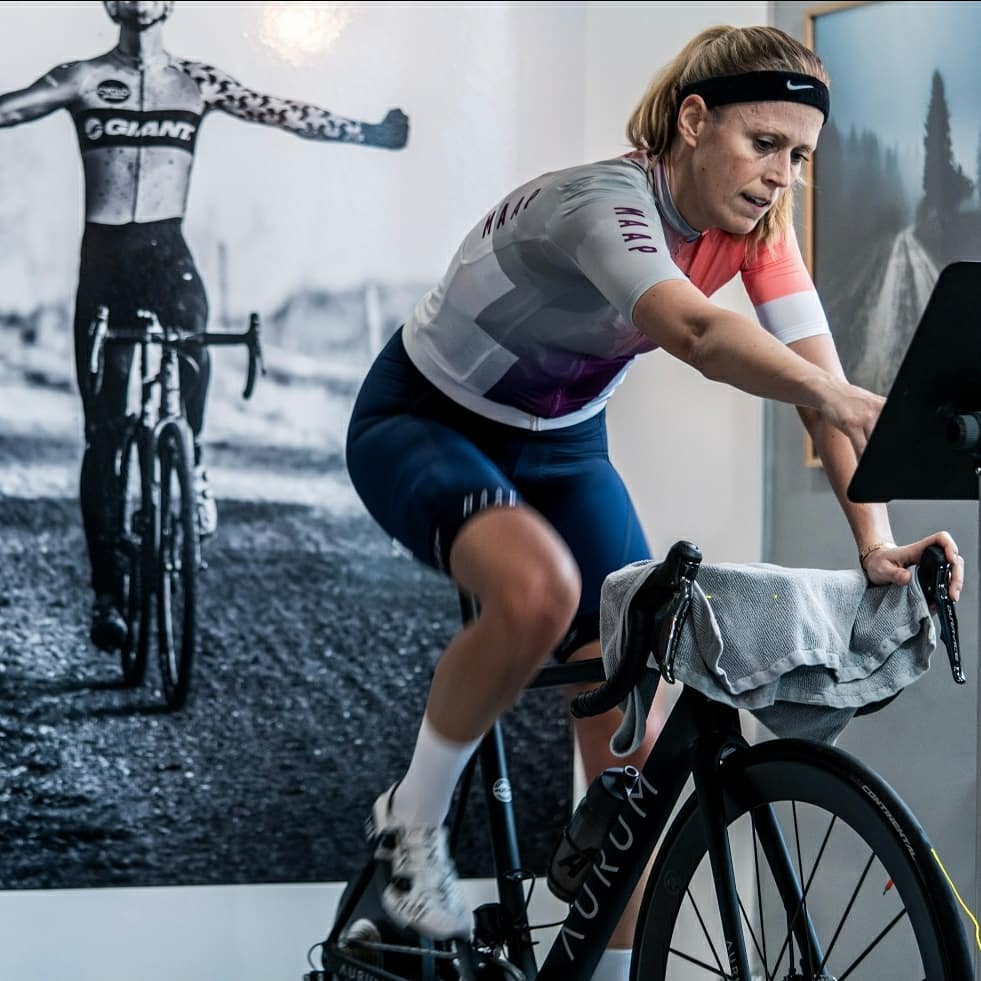
Prior to the activities described in this article, I had a really exciting day with Thomas Mortensen. Among other things, we set out to test the effect of warm-up again, this time in a slightly different way. In our lab, we put my bike on the turbo-trainer, started the fan and I got into my cycling gear.
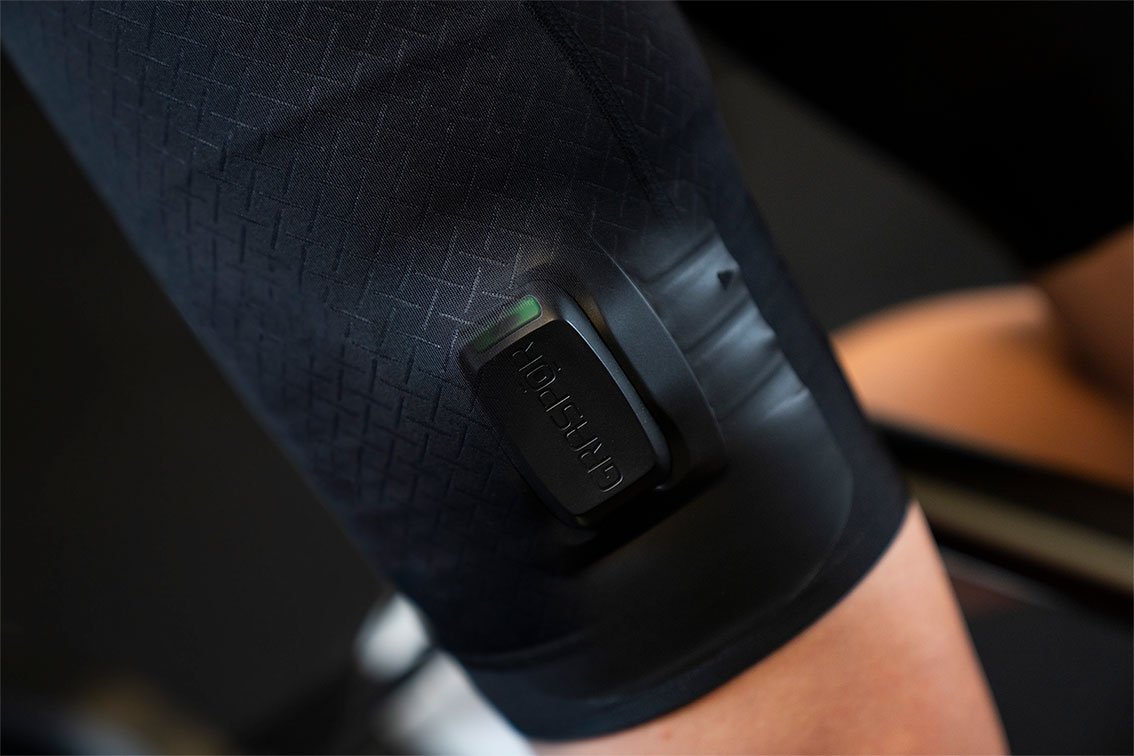
”The aim of the experiment was for me to do a warm-up with my right leg, while at the same time my left leg was to just hang down. We positioned a GRASPOR on both legs, so we could see the oxygenation for each leg separately. My warm-up protocol was precisely the same as that in my previous article:
- 8-min at 150 w
- 3-min progressively increasing from 200-350w
- 1-min rest.
- 3-min progressively increasing from 200-350w
- 1-min rest.
- 2*12-sec. sprints (700-800w) with 1-min rest between.
- 1-min rest.
However, as I only had one leg to deliver the power down to the pedals, all of my watts were divided by 2. After I finished the warm-up, I was to ride for 10-minutes at 200-220w, with both feet on the pedals. Following these 10-minutes, I would then ride for 3-minutes at 350w, to see the effect at a higher load before rolling-off.”
The warm-up
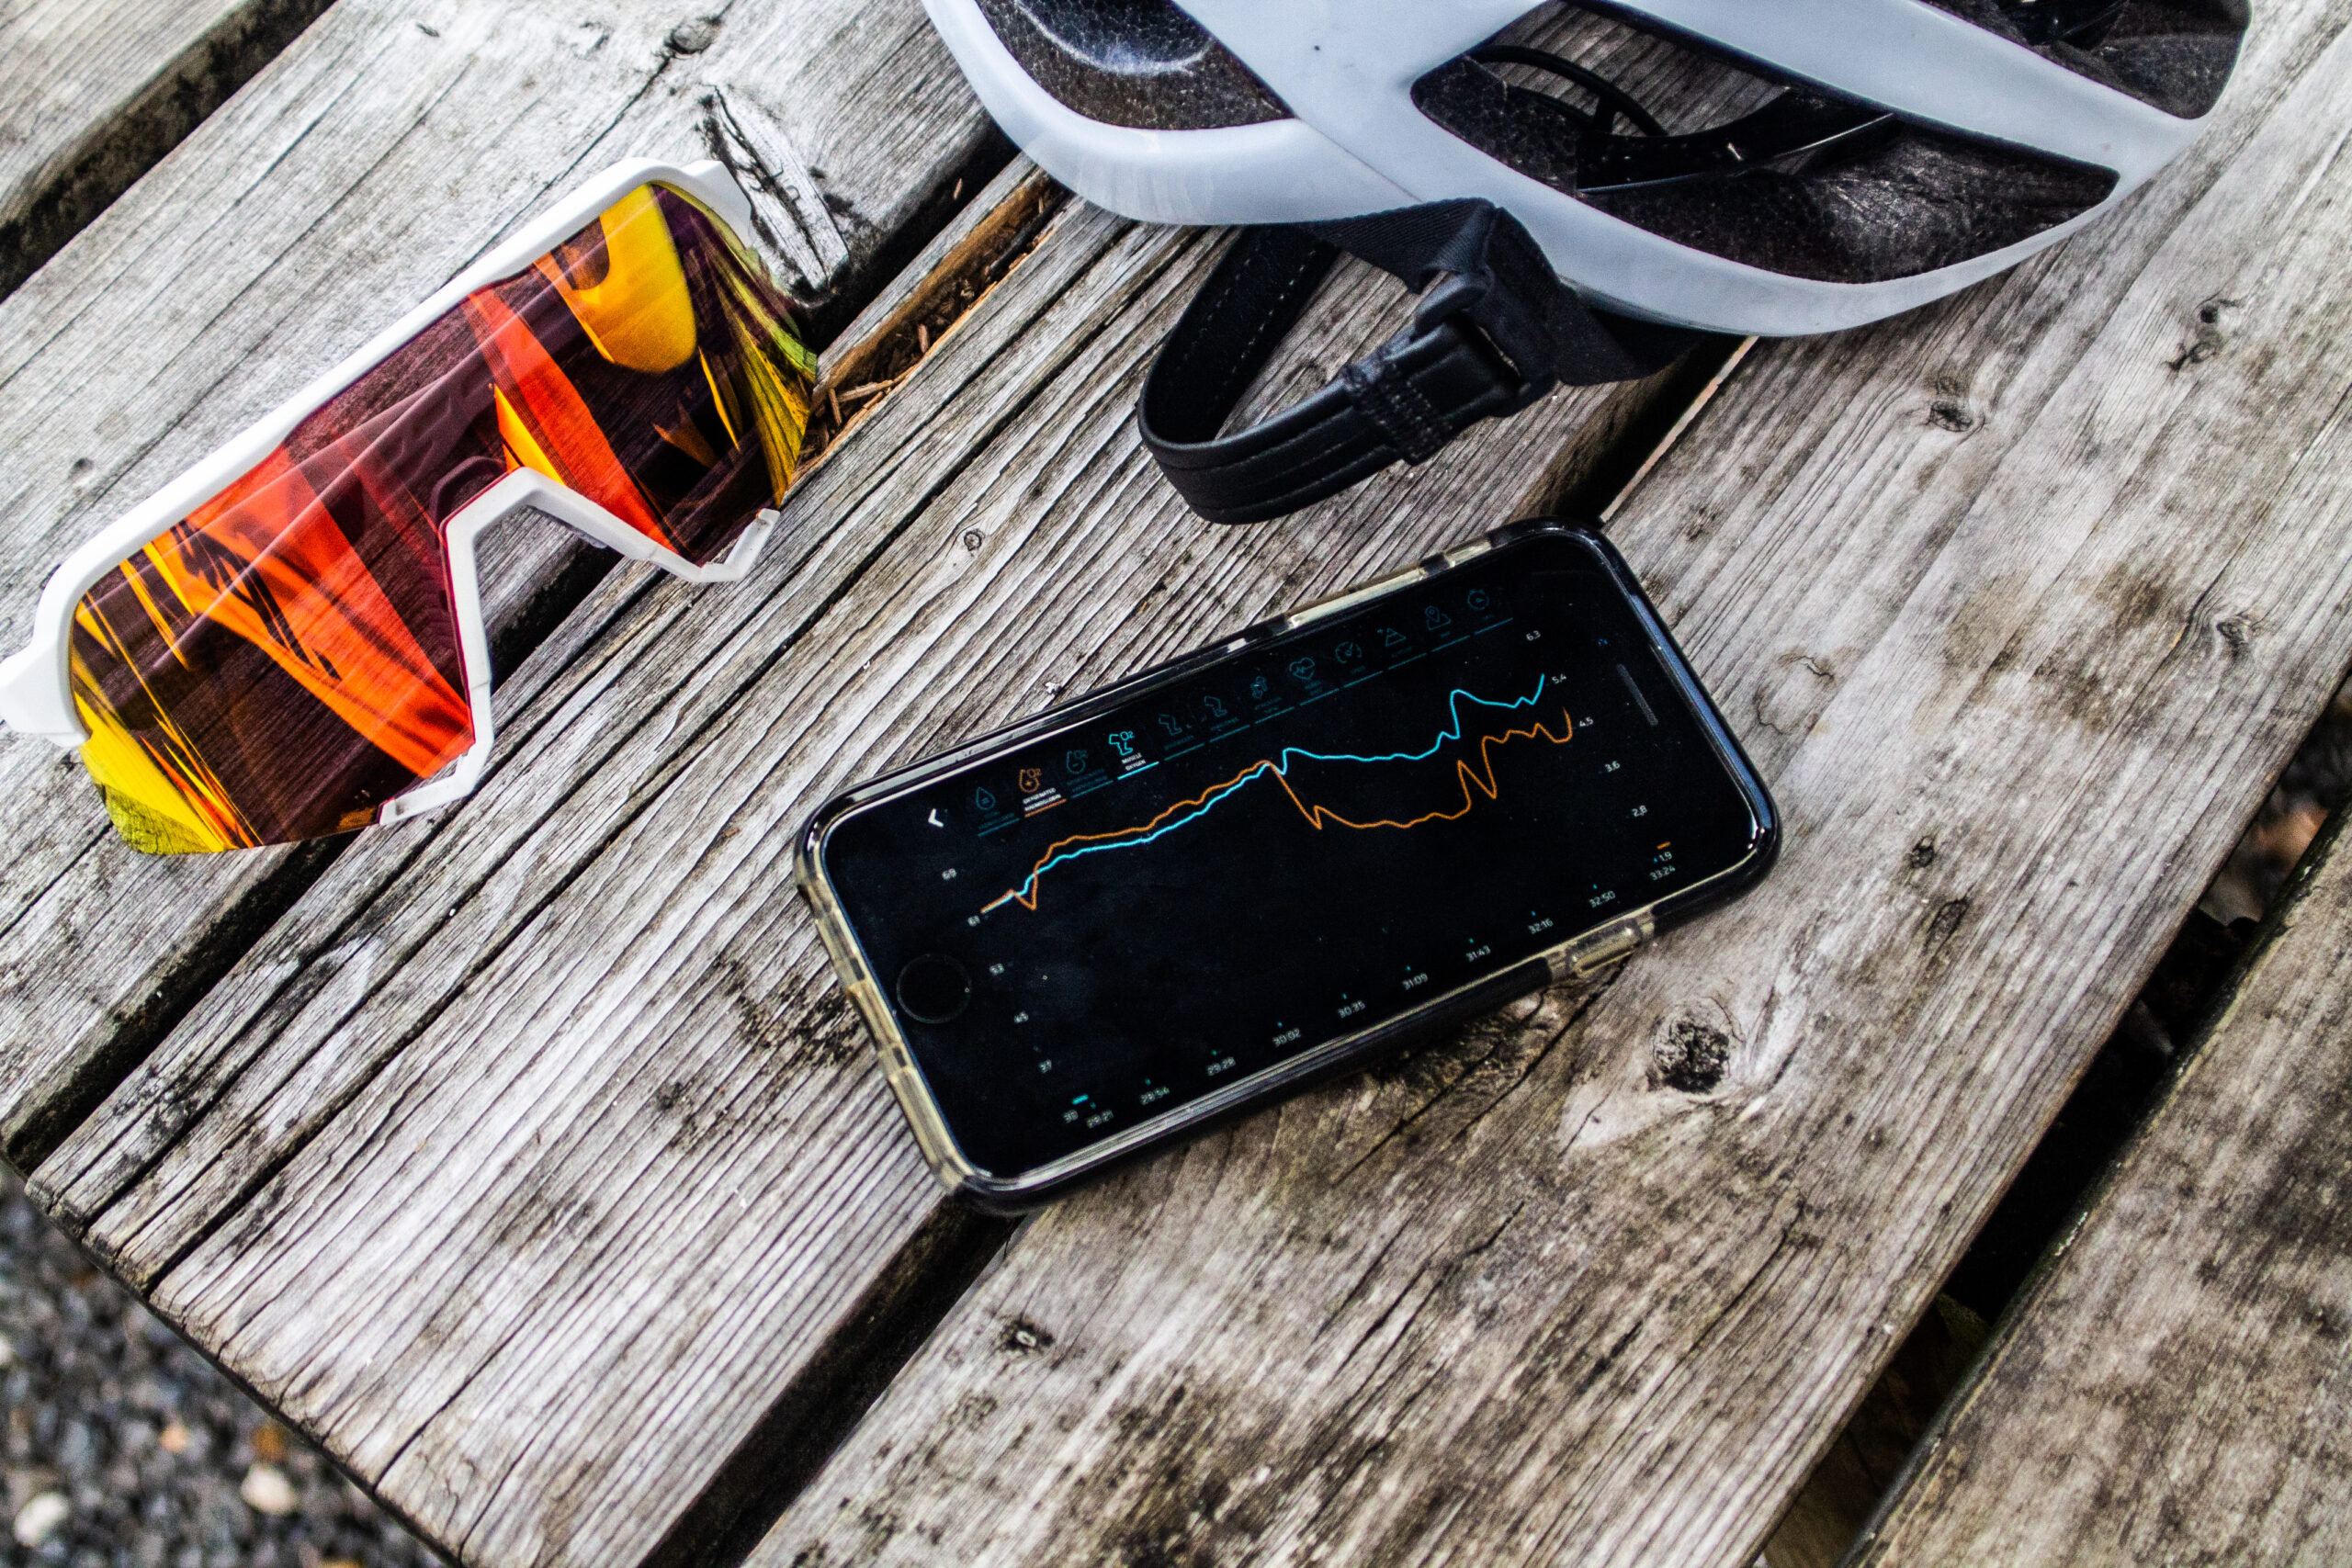
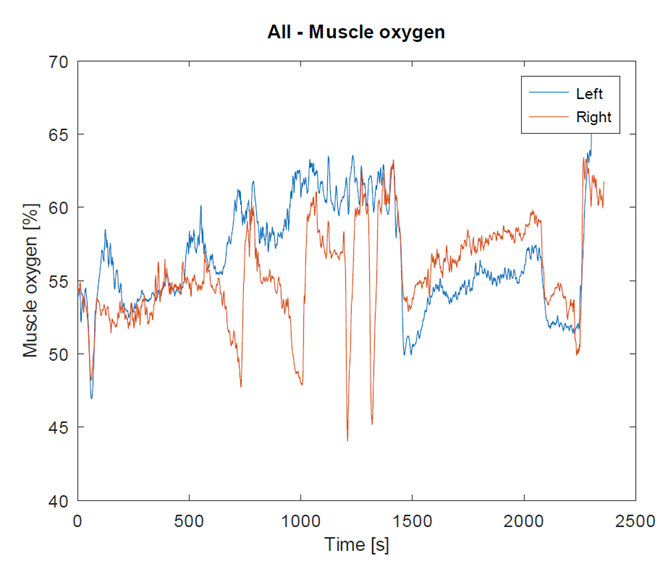
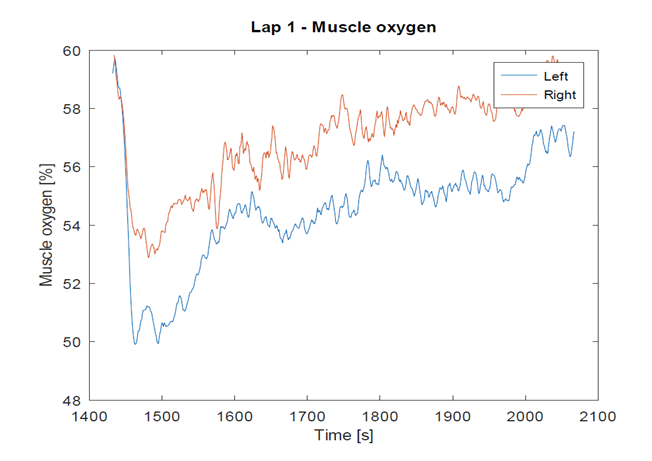
The image to the left shows my muscle oxygenation during the entire test. The blue graph shows oxygenation in my left leg, that hung down during warm-up, and the red graph shows my right leg that was active throughout. It is very clear to see how oxygenation is higher in my left leg during warm-up because it just hung down, and oxygen consumption in the muscle did not increase. In contrast, oxygenation was lower in the right leg that was active and which oxygen consumption increased.
During the 2 * 3-minute progressive intervals, where oxygenation in the right leg fell, the inactive leg was also seen to be affected. This is because heartrate increased to supply the one leg that was active while it performed the warm-up, and which increased the blood supply to the whole body, including the inactive leg. This means that the inactive leg actually experiences an effect from the other leg having been active. This is also seen on the graph below, where blood supply to both legs is seen to rise during the warm-up.

After the warm-up
After completing the warm-up, I clicked my inactive left leg into the pedal ready to ride for 10-minutes at 200-220 w.
As can be seen from the graph, from the beginning there was a difference in oxygenation between the two legs. Oxygenation was higher in my right leg which had been active in the warm-up. Right from the beginning of the 10-minute ride oxygenation in my left leg can be seen to be down to 50%, where in the right leg it stabilizes at just under 54%.
Relating the result to my threshold test
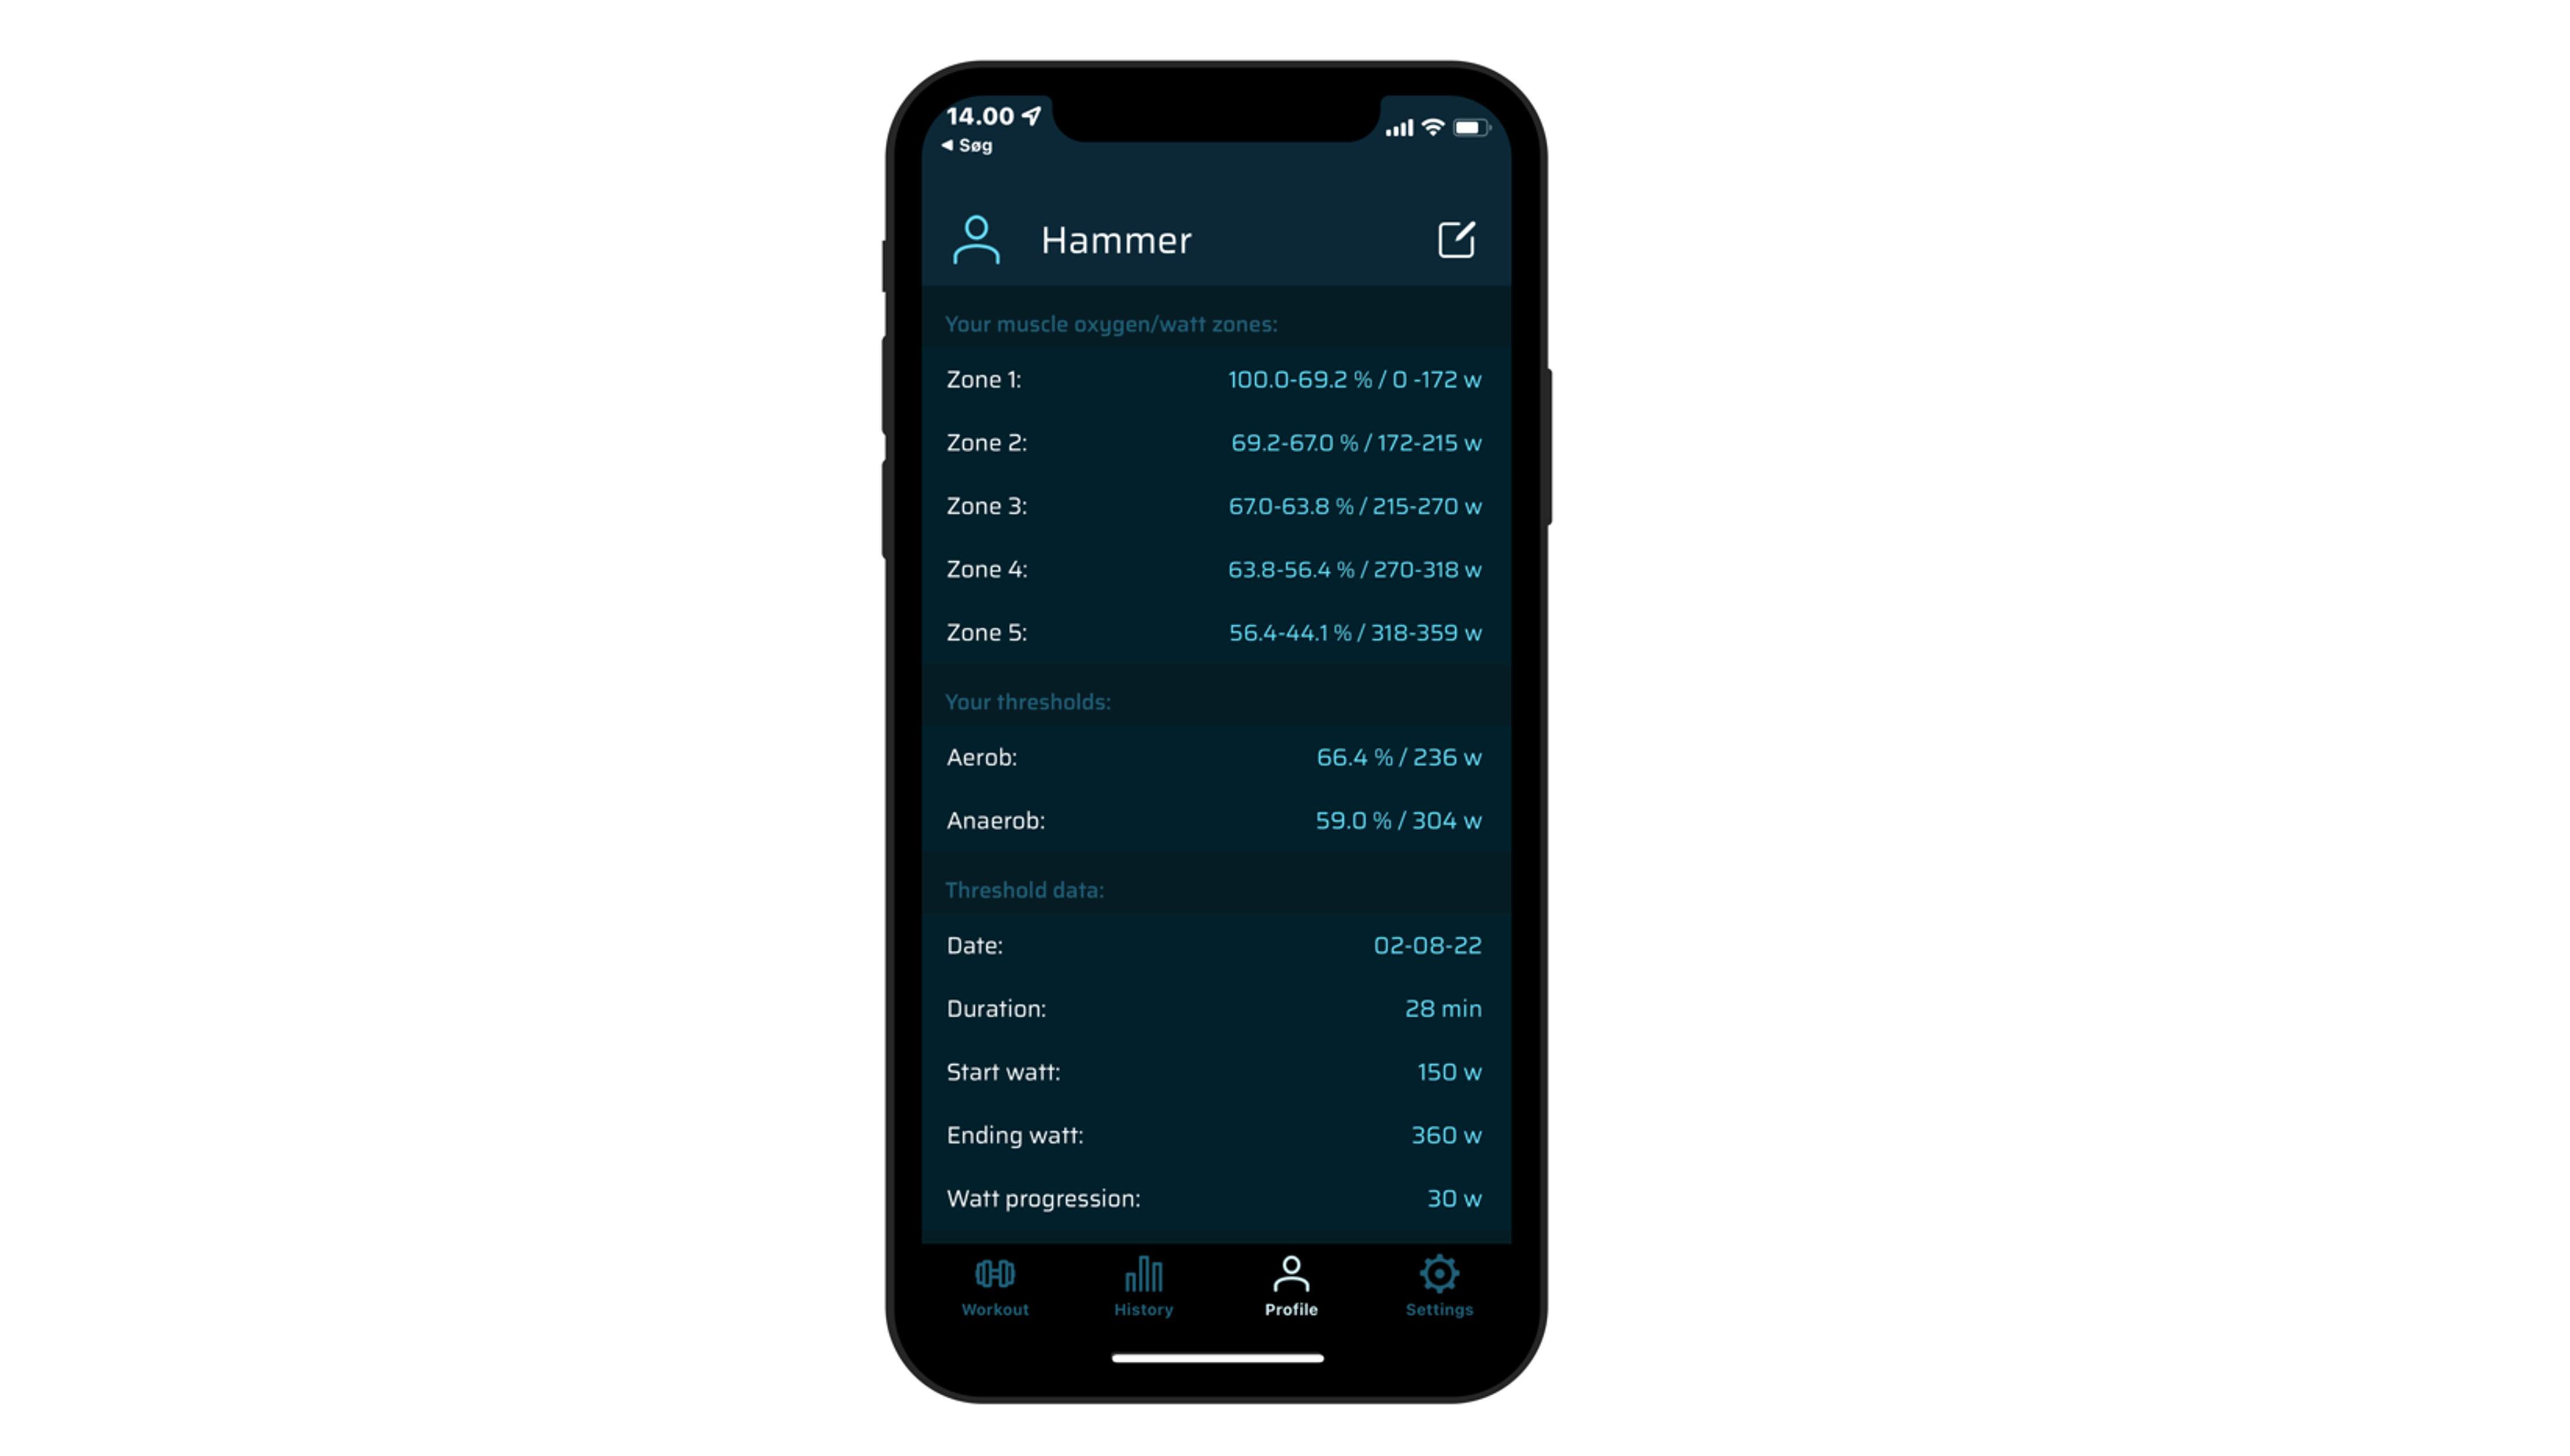
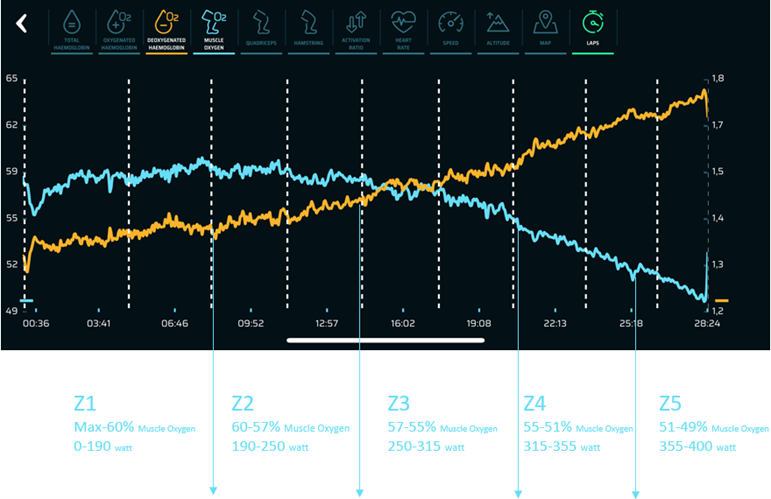
As can be seen from the test, the 59% oxygenation corresponds very well with the fact that I should ride at between 200-220 watts in Z2. But it is also seen that the 56% oxygenation corresponds to my riding at 270-280 watts, in Z3. This means that even though my left leg had an increased blood supply during the warm-up, there is still a marked difference after 10-minutes of activity at 220 watts.
The above is, at least in part, due to my left leg not being ready to pull the oxygenated haemoglobin from the capillaries into the muscles, where the oxygen is converted into energy.

This can be seen in the graph below, where the amount of oxygenated haemoglobin is higher in the right than left leg.

Next up: more intensity
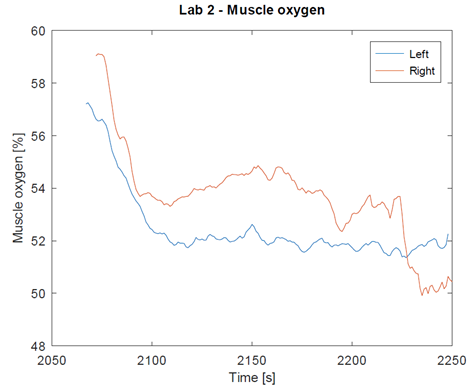
After completing the 10-minute ride, I switched directly to riding for 3-minutes at an average 350 watts. This is the upper limit of my Z4, and just before my VO2 max. Here I was really interested to see if there was still an imbalance in oxygenation between my left and right legs, after having ridden for 10-minutes where both legs were active.
There was still a difference, as seen in the graph to the right. For the first two minutes, there was a difference of 2 percentage points. In the end I stand up in the pedals to maintain the 350 watts. Here, however, it is oxygenation in my right leg that falls significantly. This is because I primarily use my right leg to stand up. This means that, in the end, it is my right leg that is stressed hardest.
Personally, I am not so surprised that there is a difference of 2-3% between the right and left legs. In my previous article I described the noticeable differences I also experienced there, so that I stressed my left leg with the equivalent of 60-80 watts more, does not come as a surprise. What does surprise me is how my legs recovered after these 13-minutes where they were first stressed by the 10-minutes at 200-220 watts and finished with 3-minutes at 350 watts.
What about recovery?
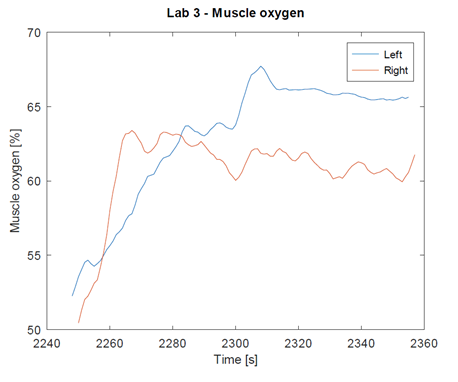
In the graph to the left it can be seen how my right leg stabilizes at 62% oxygenation after just 10-seconds, while it takes my left leg 35 seconds. This means that it takes my left leg 25 seconds longer to reach the same oxygenation level as my right leg.
If, like many, I now go out and ride steadily for 15-20-minutes before beginning some 40/20 intervals, where riding for 40-seconds at around VO2 max/Z5 is followed by 20-seconds of riding steadily to recover, then I would actually need almost twice as long to be fully recuperated and ready for to ride each new interval. This means that if I start a new interval after 20-seconds, my oxygenation will fall much further, and my muscle will be stressed far more than in the first interval.
This may also be the intention with some intervals. With GRASPOR, however, it is possible to use Muscle Oxygen to manage and understand how these intervals and warm-up etc. affect your muscles. If I personally was intending to ride 40/20 intervals, and I recover after 10-seconds after warm-up, then I would not achieve the desired effect, where my recovery level is steadily reduced. I would not be achieving the intended stimulation /stress.
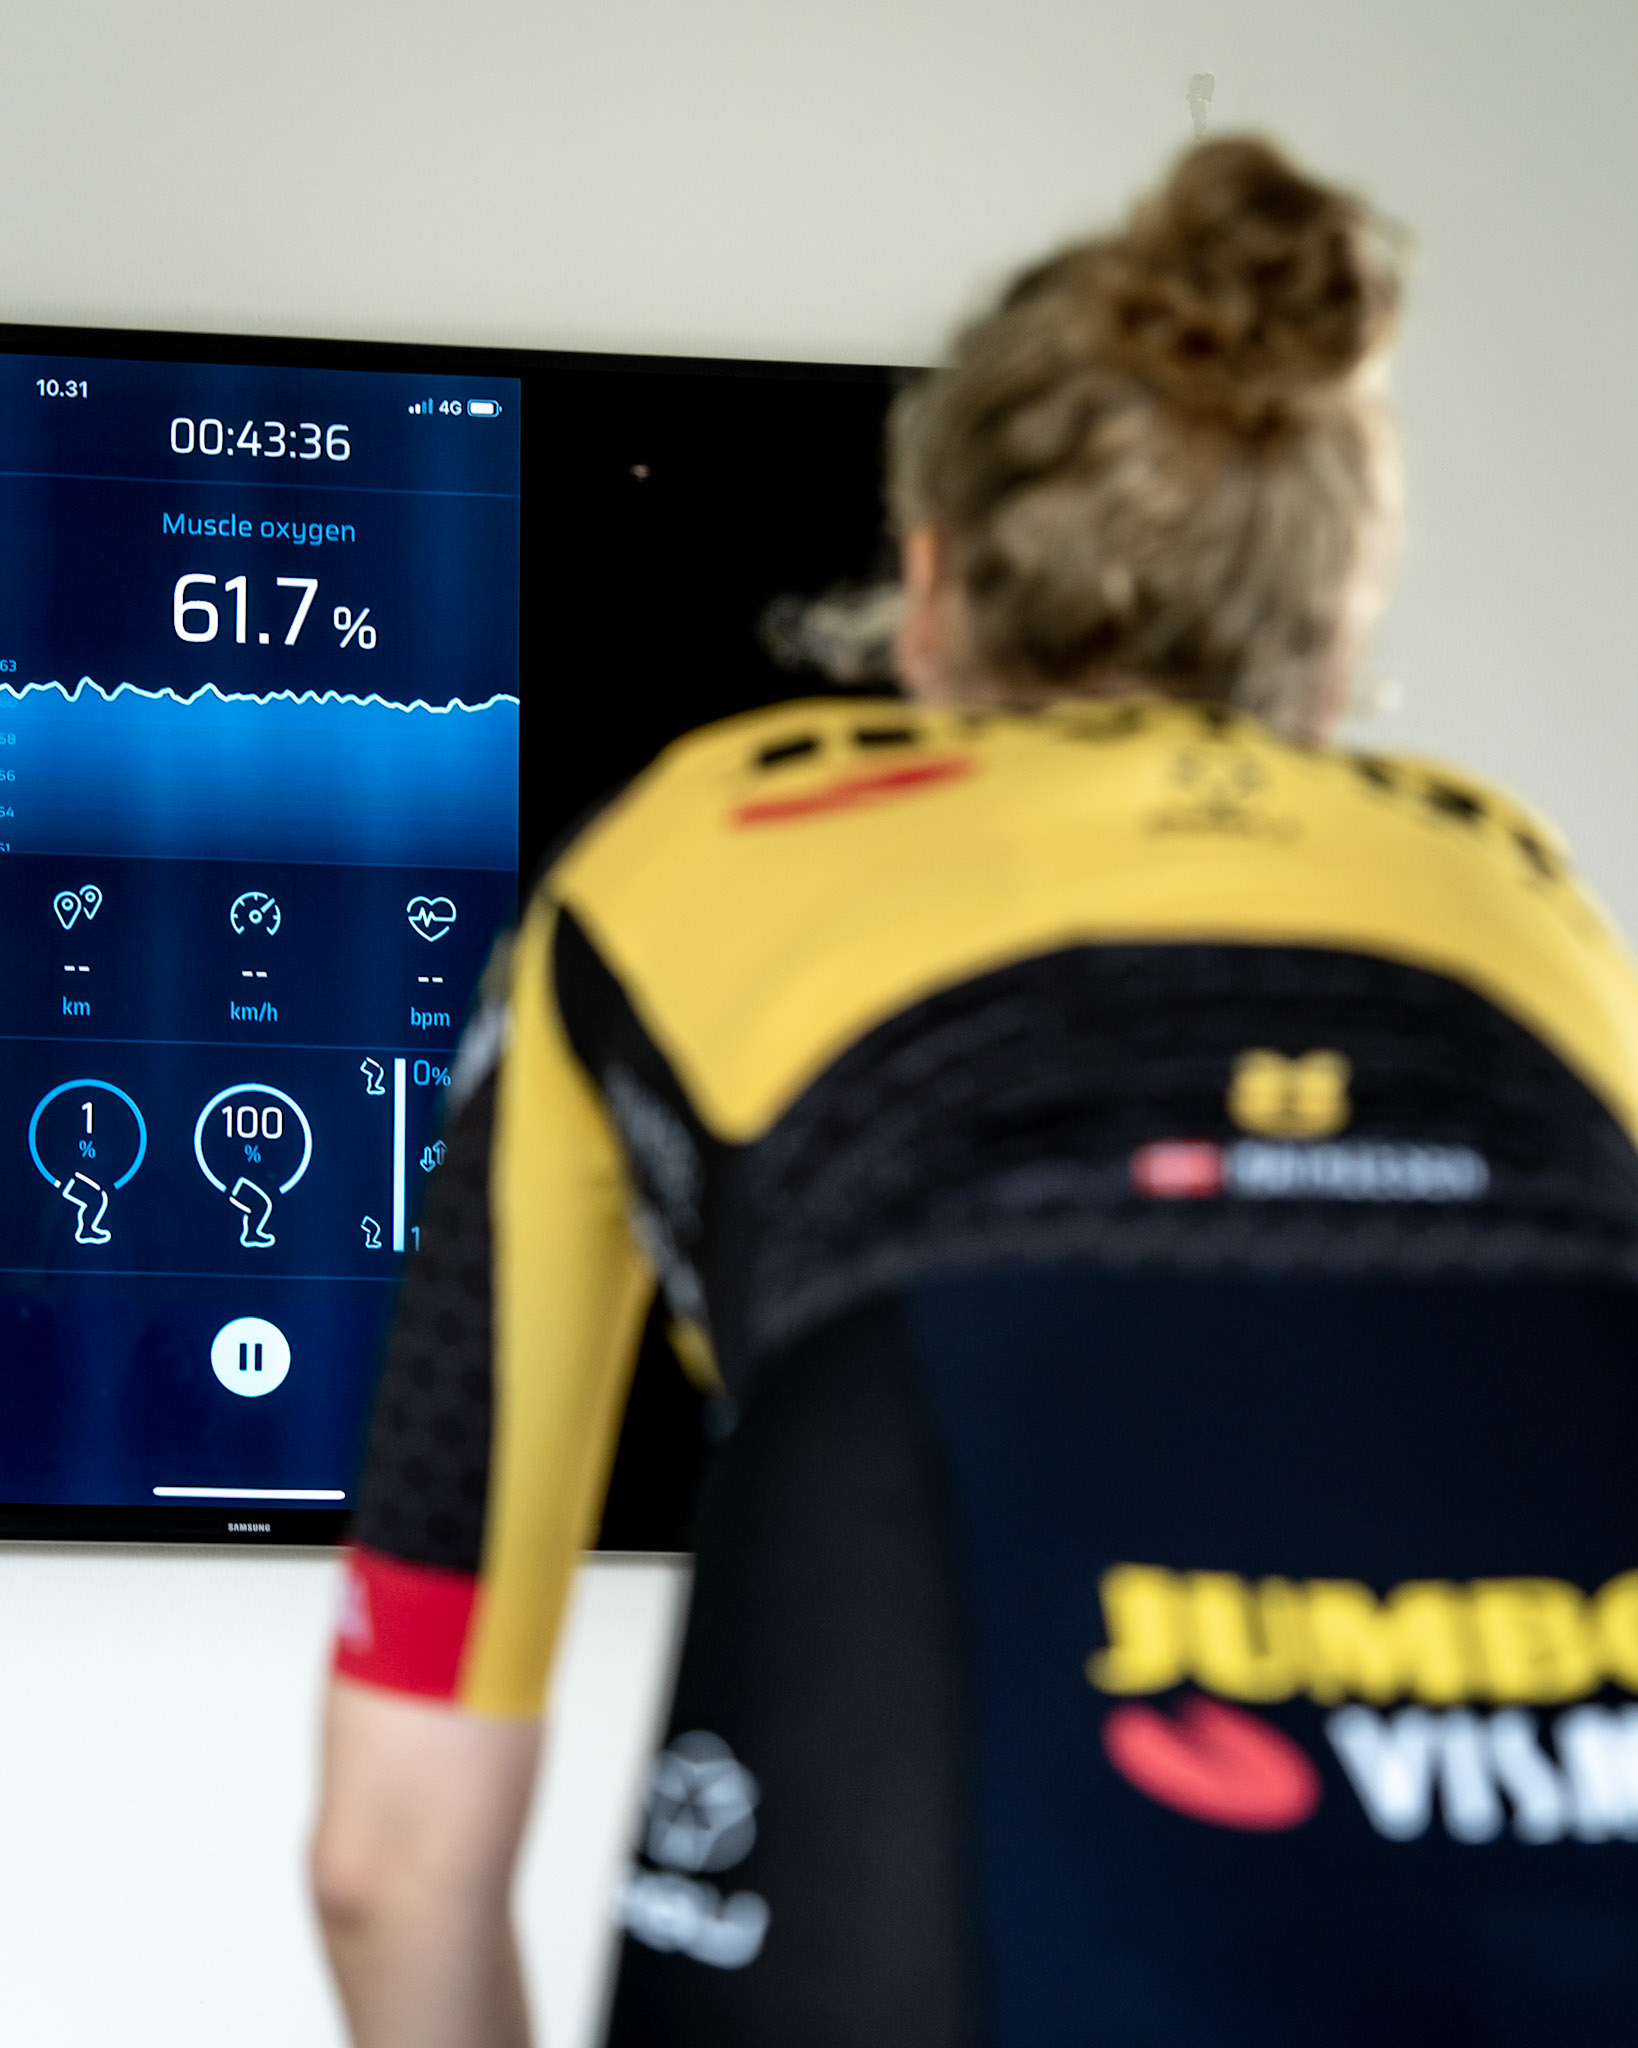
This is a clear advantage of GRASPOR, that you can understand your warm-up and how your muscles recover.
Personally, I think this understanding can help everyone to improve their performance. #Knowmoredobetter.
See you on the road #GRASPORING!
Continue leaning about GRASPOR with our oher articles


